How to Create and Edit Custom Reports in SocialPilot Reviews?
The Custom Reports feature in SocialPilot Reviews lets you build detailed, fully personalized reports for any brand by choosing the exact locations and platforms you want to analyze.
Instead of relying on fixed templates, you can create reports that focus on the data that matters most, compare location performance, track platform-specific ratings, customize layouts, and even schedule automatic deliveries. Everything is built and managed from one organized dashboard, making reporting flexible, accurate, and effortless.
This article explains how to create, customize, and export your custom reports.
In this article:
- How to Create a Custom Report?
- How to Add and Manage Blocks?
- How to Add and Manage Pages?
- Understanding the Report Header Bar
- Customizing the Report Layout and Branding
- How to Handle Reconnects and Errors?
- How to Export Your Report as a PDF?
How To Create a Custom Report?
To build a Custom Report:
- Go to your SocialPilot Reviews dashboard.
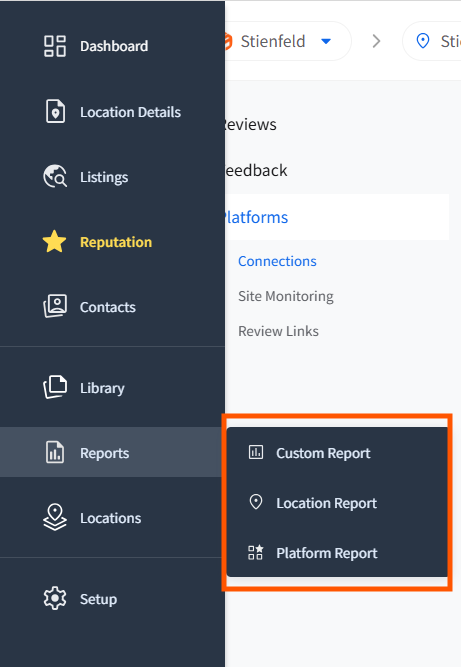
- Open the sidebar menu and click on Reports.
- Select Custom Reports to open the reports dashboard.
- From the top-left corner, select the brand you want to create a report for. The dashboard will display connected locations, platforms, and a default 30-day Timeframe.
- Either click on an existing report to edit or click Create Report on the top-right to start afresh.
- Enter a report name, and choose the platforms and locations to include.
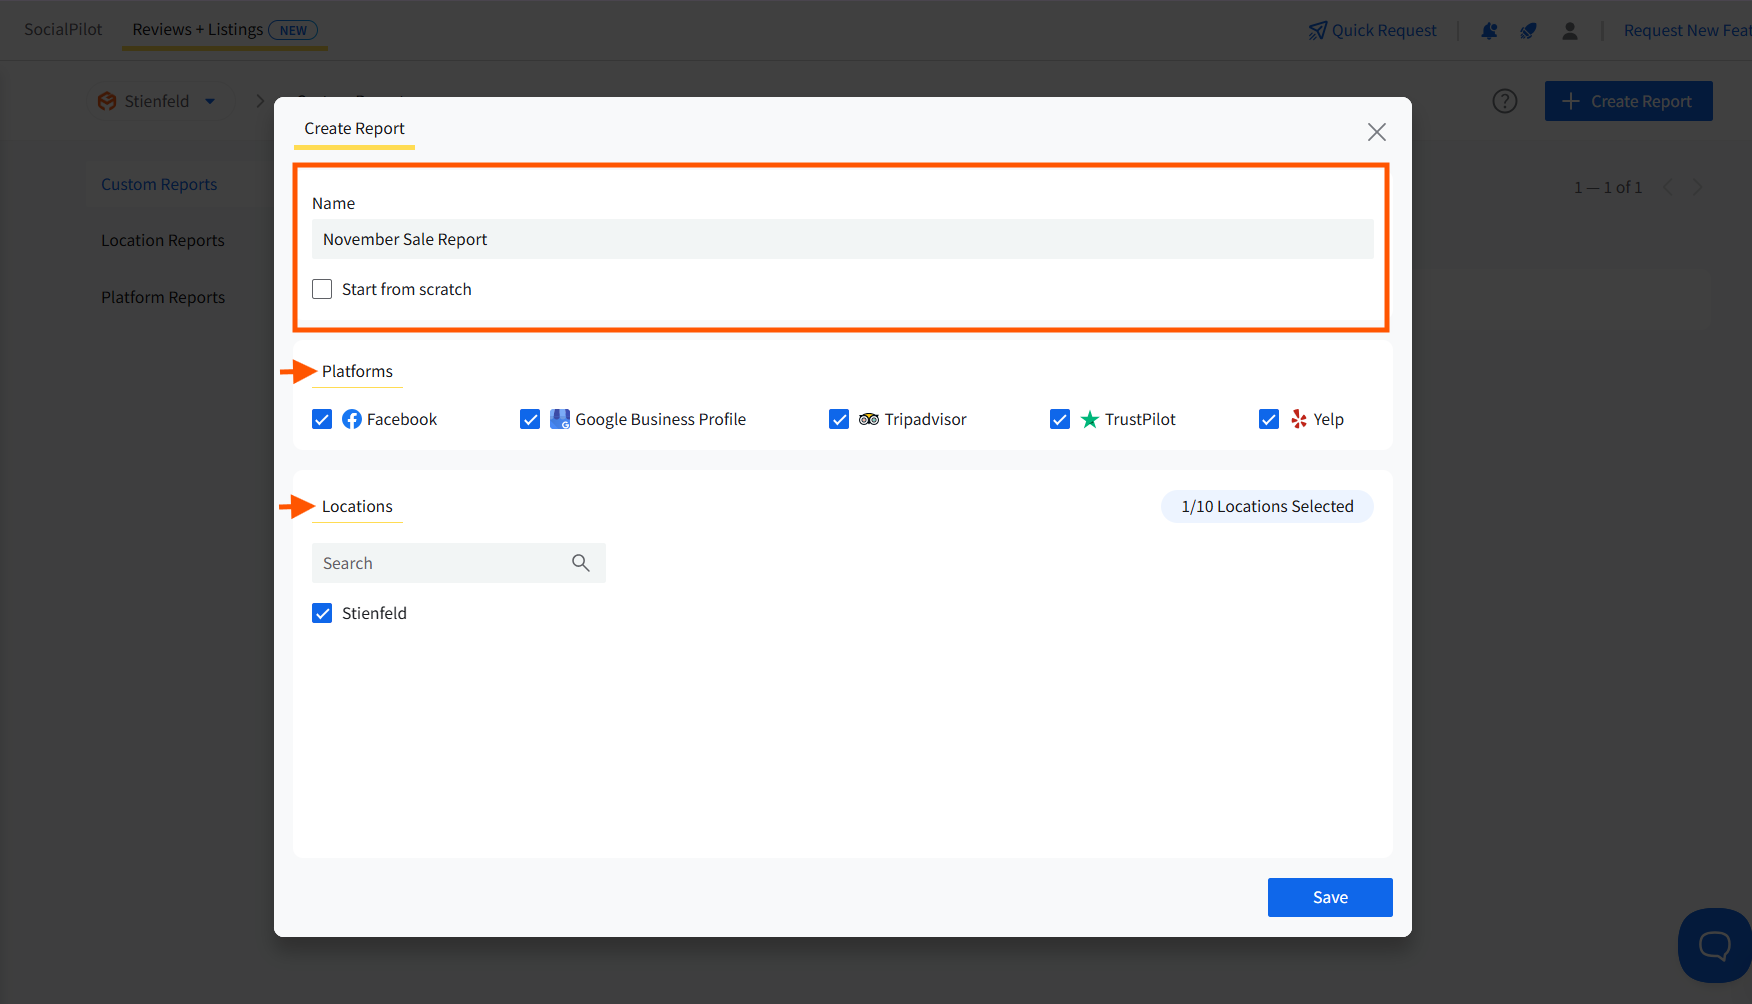
📝Note:
By default, all platforms are selected. Only locations connected to those platforms will be enabled. You can add up to 10 locations per report.
- Click Save to open your editable report.
Your report opens in Edit Mode, divided into Blocks and Pages, the two main elements of every report.
How to Add and Manage Blocks?
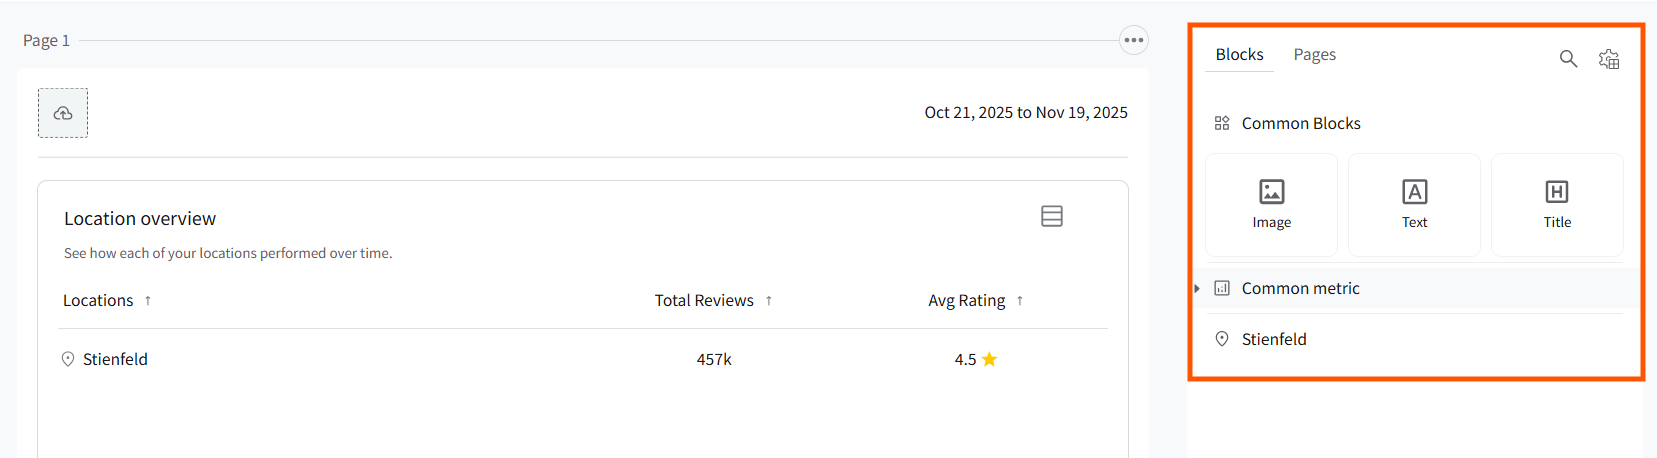
Blocks are data components that display your review metrics in visual form.
- The Blocks tab opens by default on the right side of the sidebar in edit mode.
- Expand Common Blocks, Common Metrics, or Selected Locations to view the available block options.
- Hover over any block to preview its Title, Description, and Image before adding.
- Drag and drop a block onto the Report Canvas to add it. The same block can be added multiple times if required.

- Each block includes a Resize Handle to adjust the height and width when it’s on the report canvas.
- Click the Search icon to quickly find specific metrics, platforms, or locations in the report.
📝Notes:
- Blocks that have already been added show a Green Tick mark.
- All changes are saved automatically with Auto Save.
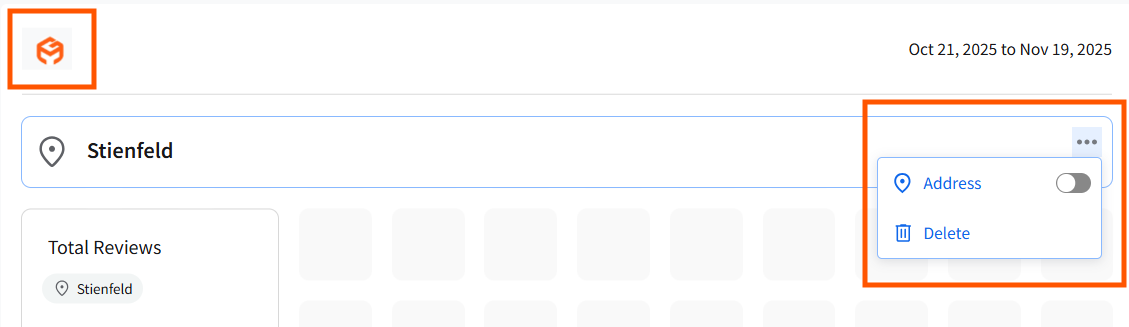
- In the top block of the page, you can toggle your Profile Picture and Address on or off to control what information is shown.
How to Add and Manage Pages?
Pages help you organize your report into structured sections.
- On the right side of the sidebar, beside the blocks tab, you will see a pages tab. Click on it to open the list of pages.
- The active page is highlighted. Click on any Page Name to navigate to it.
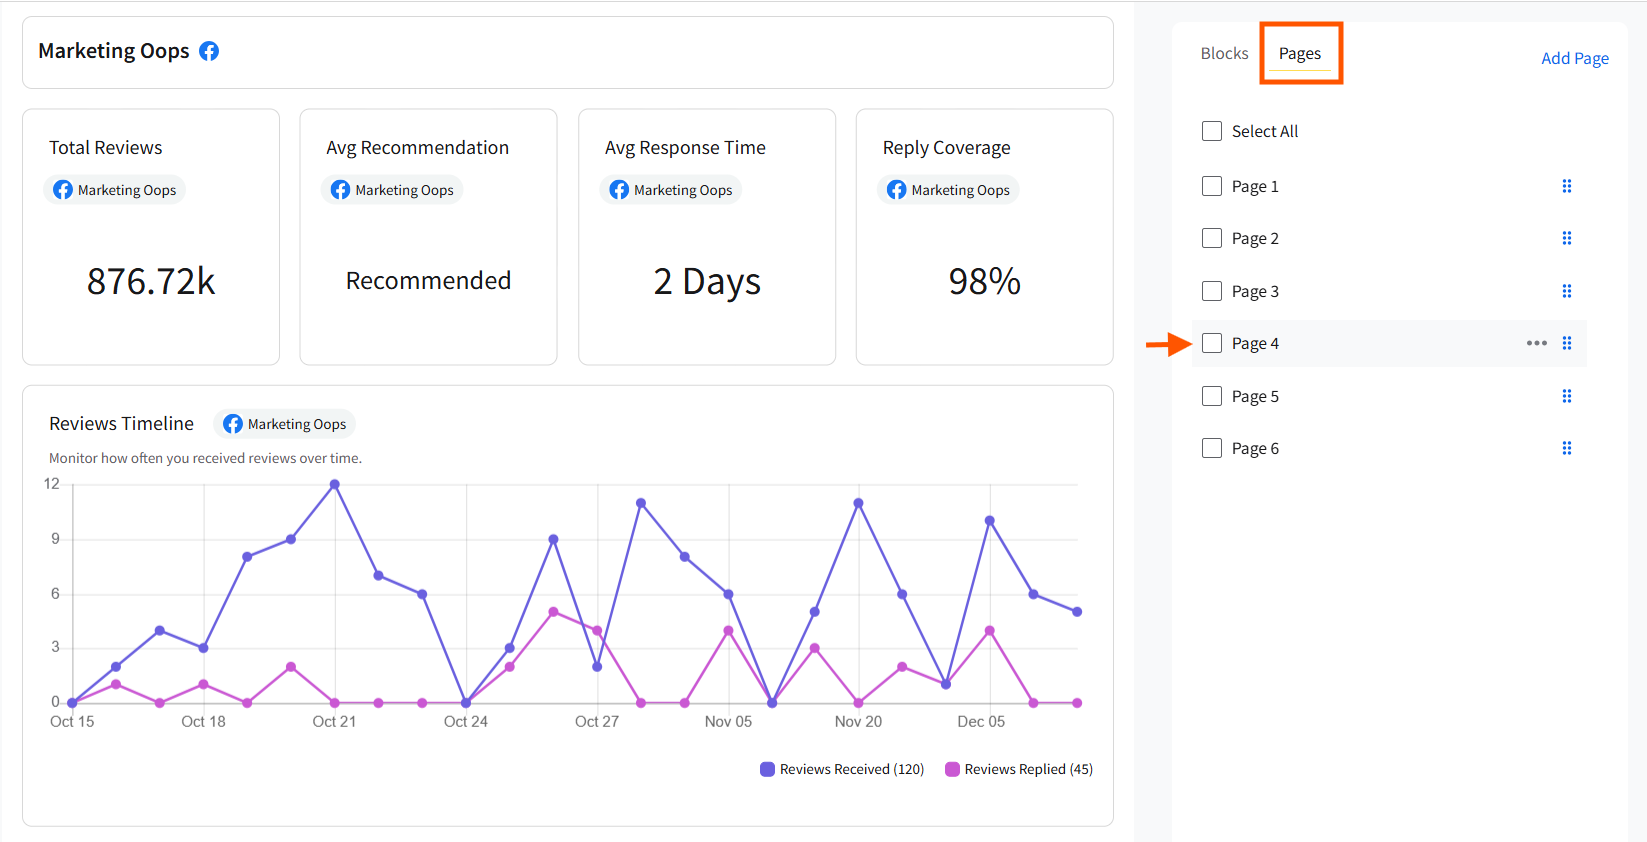
- Click Add Page to create a new page. Pages are automatically named Page 1, Page 2, and so on.
- Double-click the Page Name to rename it. Page names can be repeated and are only used internally.
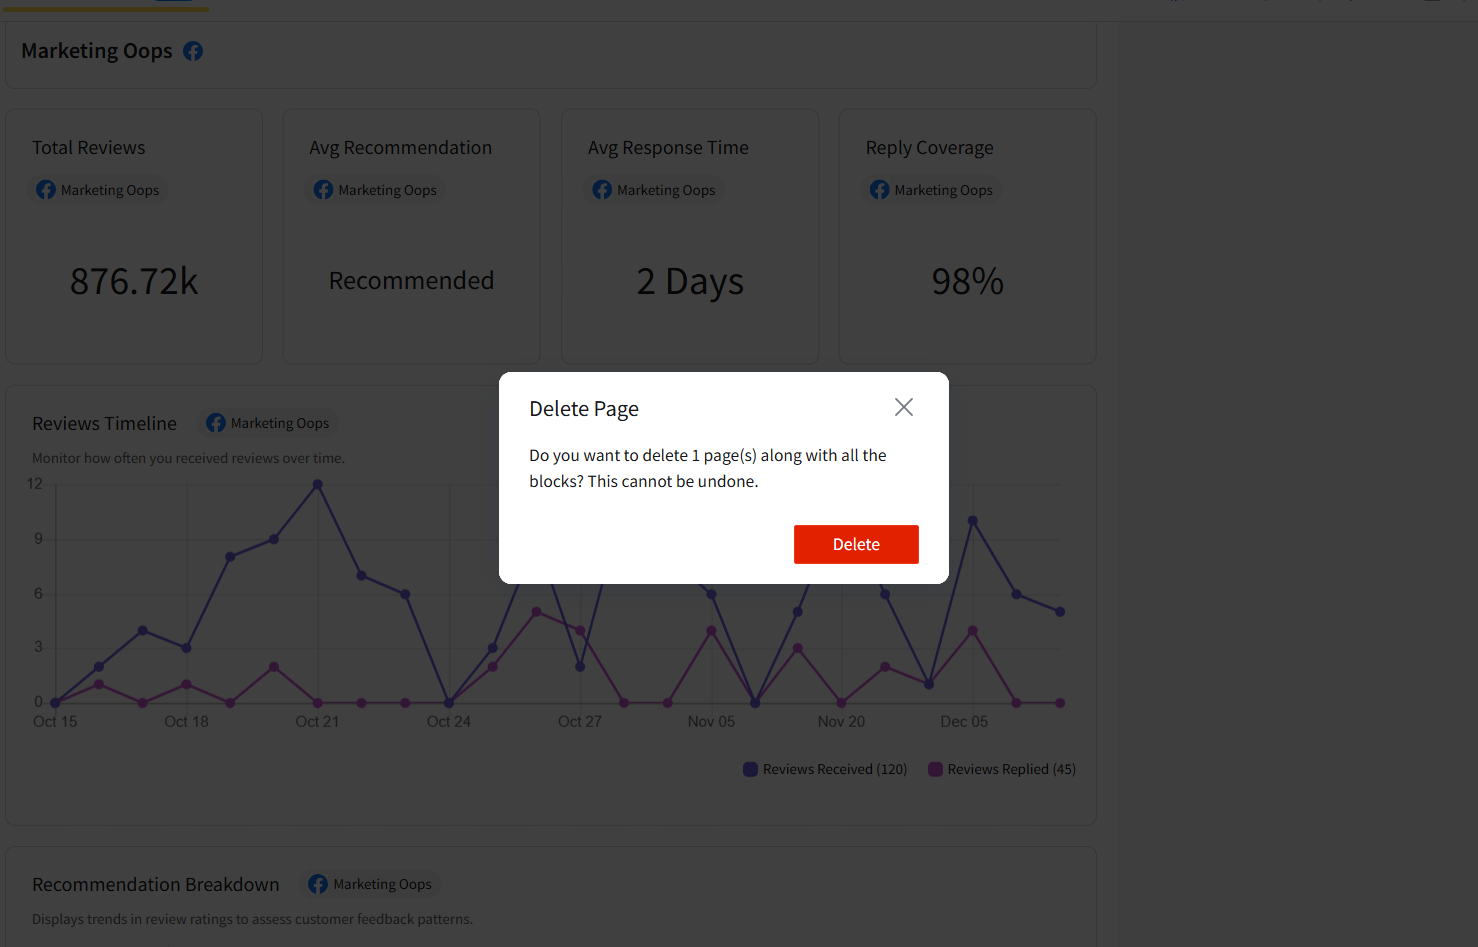
- Click the Three Dots next to a page name and select the Trash icon to delete the page.
- If a page contains blocks, you’ll see a Delete Confirmation Popup.
- Empty pages are deleted immediately.
📝Notes:
- If the report is blank and you add a block without creating a page, Page 1 gets automatically created.
- Click on the Manage Report icon to select, deselect, or remove locations and platforms at any time.
Understanding the Report Header Bar
The Header Bar at the top of your report acts as your main control center. It gives you quick access to all essential functions and ensures your reporting process stays organized and efficient.
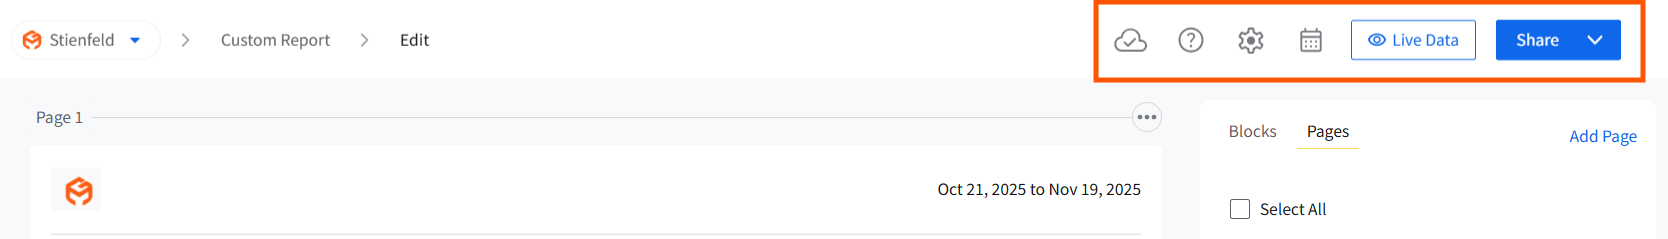
Here’s what you can do from the header bar:
Edit Report: Indicates that you are in editing mode.
Share Options: It lets you download reports as PDFs, email them, or schedule automated deliveries.
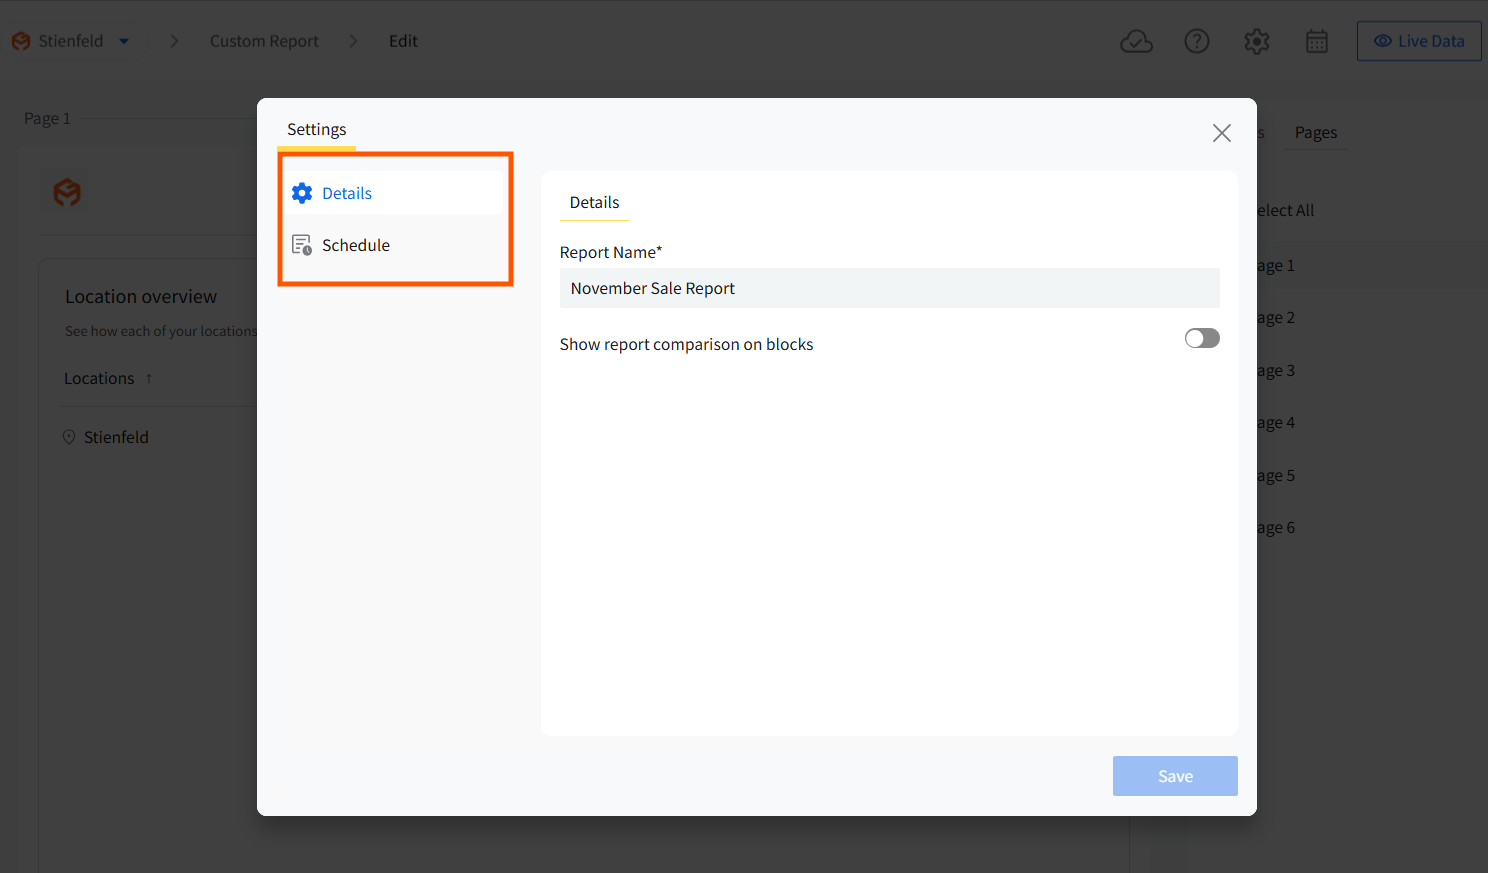
Report Settings: Allows updating the report name, adjusting scheduling preferences, or managing delivery setup.
Live Data Toggle: Helps you view live metrics anytime.
Auto-Save Indicator: Confirms that every change is automatically saved.
Customizing the Report Layout and Branding
You can also personalize how your reports look:
✔️ Add or Update Logo: Upload the brand’s logo for professional, White Labeled Reports.
✔️ Customize Headers and Footers: Modify layout elements to match your brand identity.
✔️ Apply Consistent Styling: Any branding change updates across all pages automatically.
✔️ Adjust Report Layout: Reorder, resize, or hide elements to maintain a clean, polished presentation.
How to Handle Reconnects and Errors?
If any platform or location requires attention:
- The platform name will appear in red in the right sidebar.

- Click Reconnect to fix access issues.
- Error Cards on the canvas can be moved or deleted like other blocks.
Once the issue is resolved, the error cards disappear automatically.
📝Note:
Inaccessible or locked blocks are automatically excluded from the exported report.
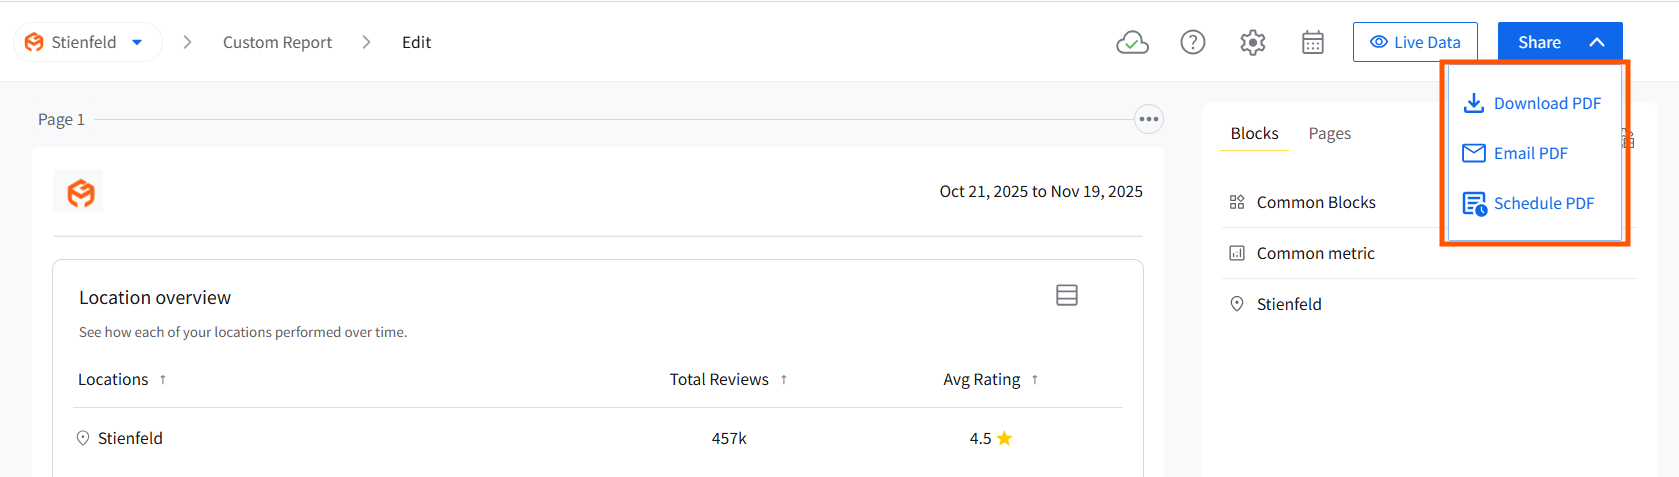
How to Export a Report as PDF?
To download or share your completed report:
- Go to the Header Bar and click on Share.
- Select Download PDF.
- The exported report includes every page, block, and customization.
📝Note:
Inaccessible or locked blocks are automatically excluded from the exported report.
🗒️Note: You can filter post-level metrics in Custom Reports by using the same Tags added to posts in Manage Posts, helping you measure campaign performance, analyze results, and simplify client reporting.